Q1 2026 SaaS Valuation and Investment Trends Report
Stay up to date
Stay up to date
"*" indicates required fields
SaaS Company Valuation & Investment Trends
(Q1 2022)
SaaS Meter leverages data from:
- The Golub Capital Public SaaS Tracker (“GC Public SaaS Tracker”), which includes publicly traded SaaS companies listed on the NYSE and Nasdaq
- The Golub Capital Private SaaS Tracker (“GC Private SaaS Tracker”), which includes private SaaS companies in the "Golub Capital Altman Index"
For additional information, please refer to SaaS Meter Definitions at the end of this report.
Q1 2022 Venture-Backed
SaaS Transactions by Round and Average Fundraising Amount
Q1 2022 Venture-Backed SaaS Transactions by Round and Average Fundraising Amount
For PitchBook’s definition of SaaS, please refer to SaaS Meter Definitions at the end of this report.
Source: PitchBook, Golub Capital
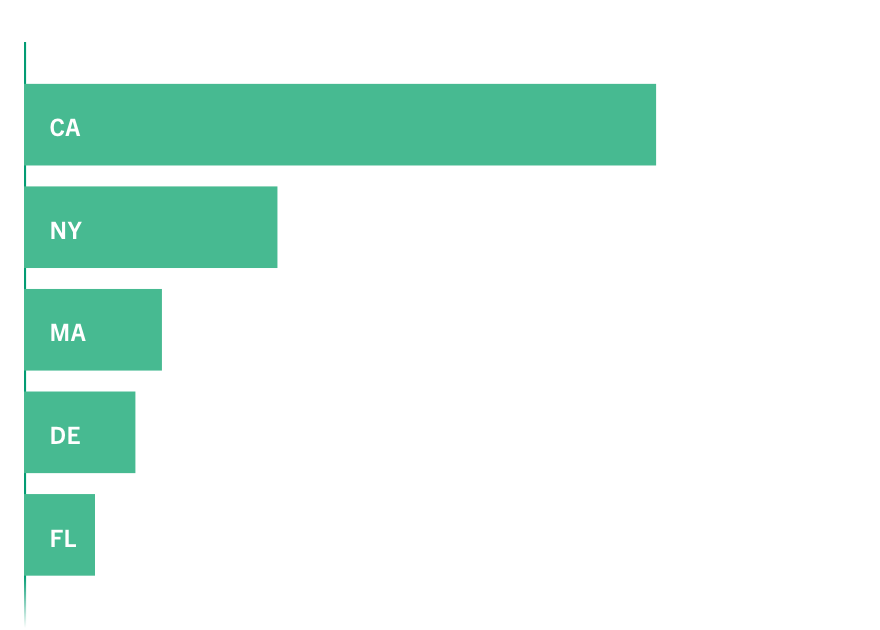
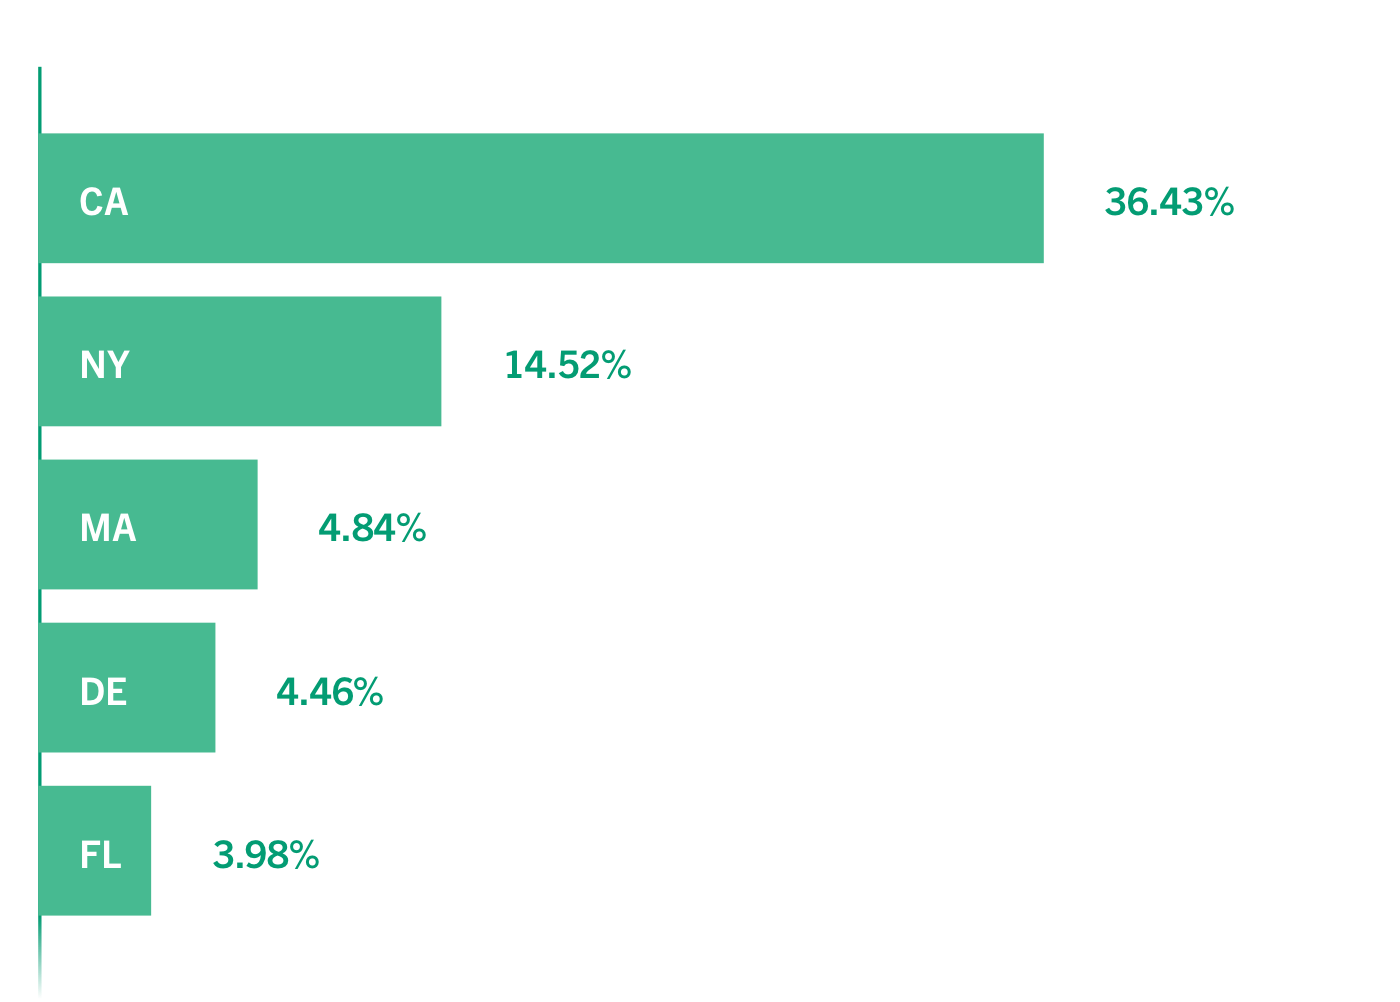
Q1 2022 States with Highest Percentage of Venture-Backed SaaS Deals
Q1 2022 States with Highest Percentage of Venture-Backed SaaS Deals
For PitchBook’s definition of SaaS, please refer to SaaS Meter Definitions at the end of this report.
Source: PitchBook, Golub Capital
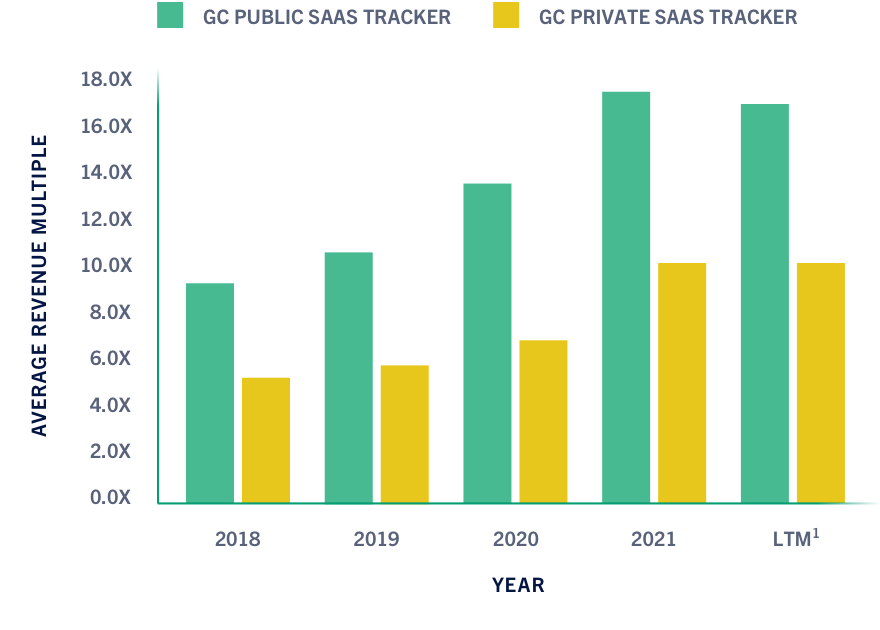
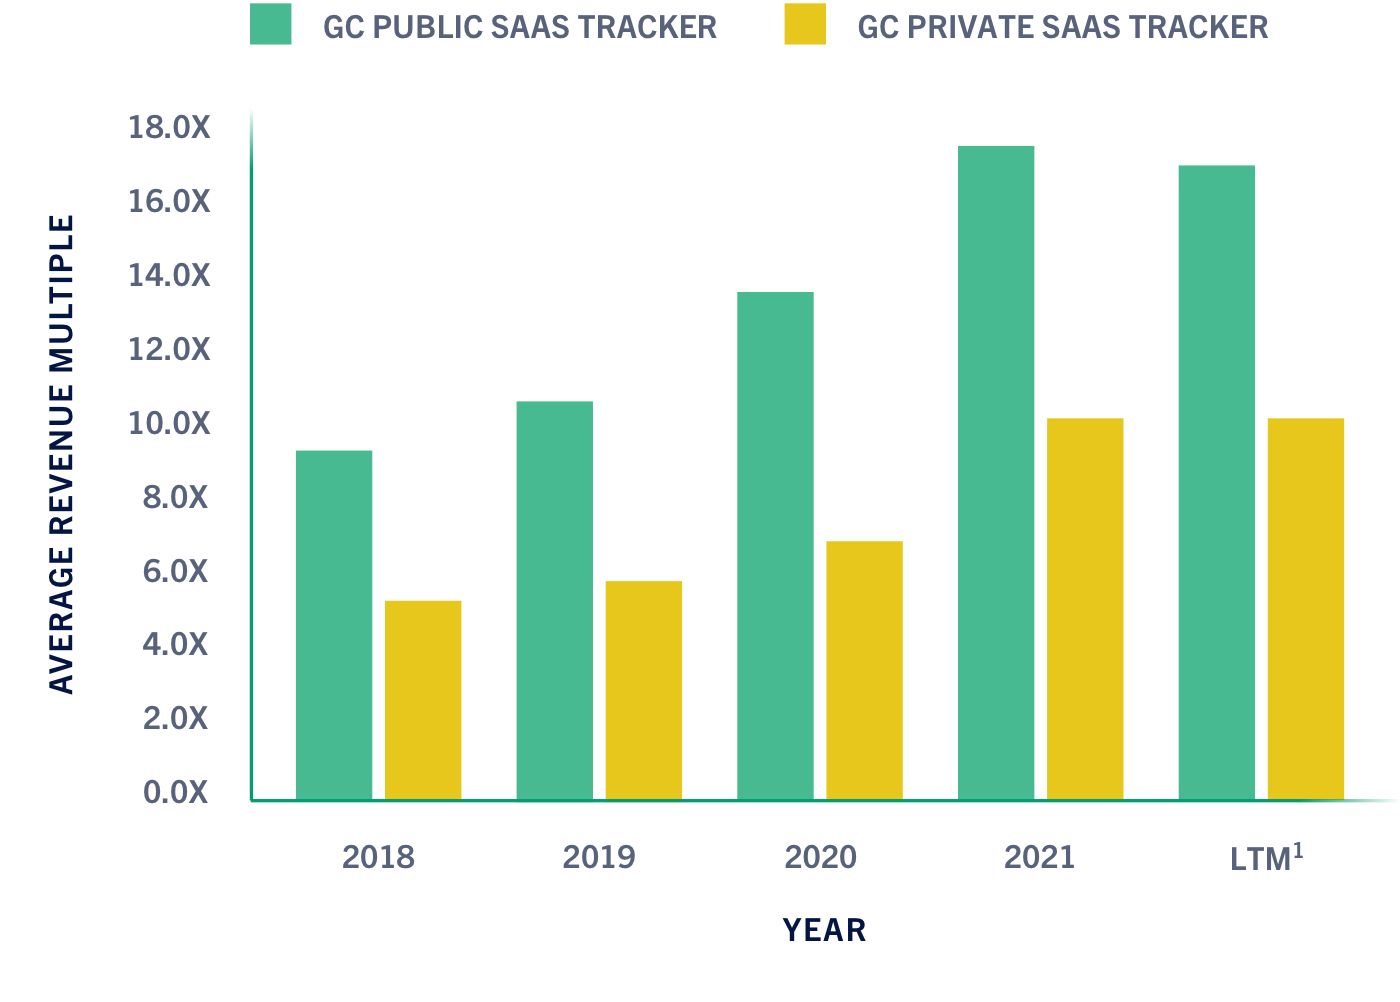
Unweighted Average LTM Revenue Multiple Comparison
Unweighted Average LTM Revenue Multiple Comparison
- LTM Period Ended 03.31.2022
Source: CapIQ, Golub Capital
GC Public SaaS Tracker vs. S&P 500 Quarterly Change1
GC Public SaaS Tracker vs. S&P 500 Quarterly Change1
- Values reflect data from the last day of the calendar quarter, assuming no dividend reinvestment.
See the end of this report for the GC Public SaaS Tracker full company listing.
Source: CapIQ, Golub Capital
GC Public SaaS Tracker Average YoY Revenue Growth by Vertical1
GC Public SaaS Tracker Average YoY Revenue Growth by Vertical1
- Values reflect data from 03.31.2021–03.31.2022.
See the end of this report for the GC Public SaaS Tracker full company listing.
Source: CapIQ, Golub Capital
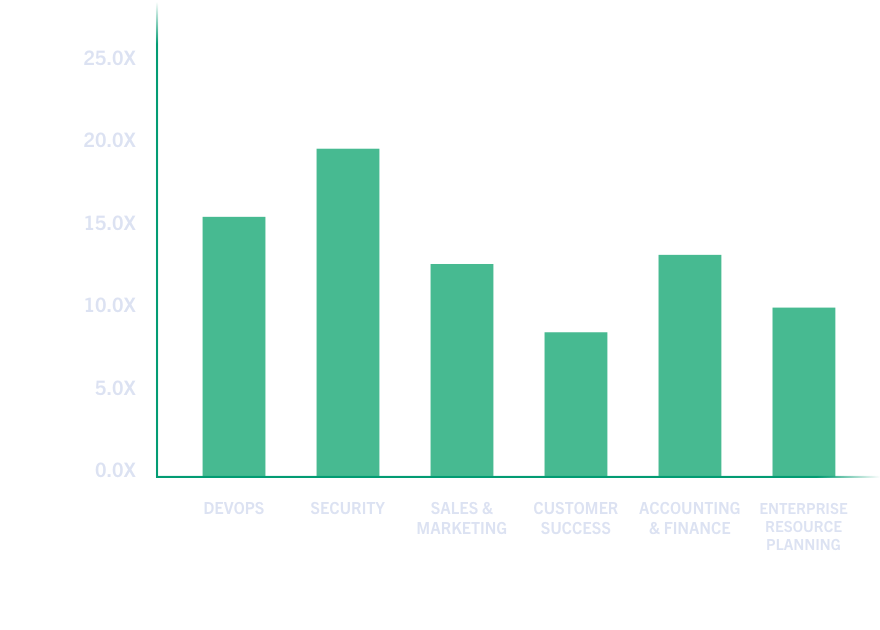
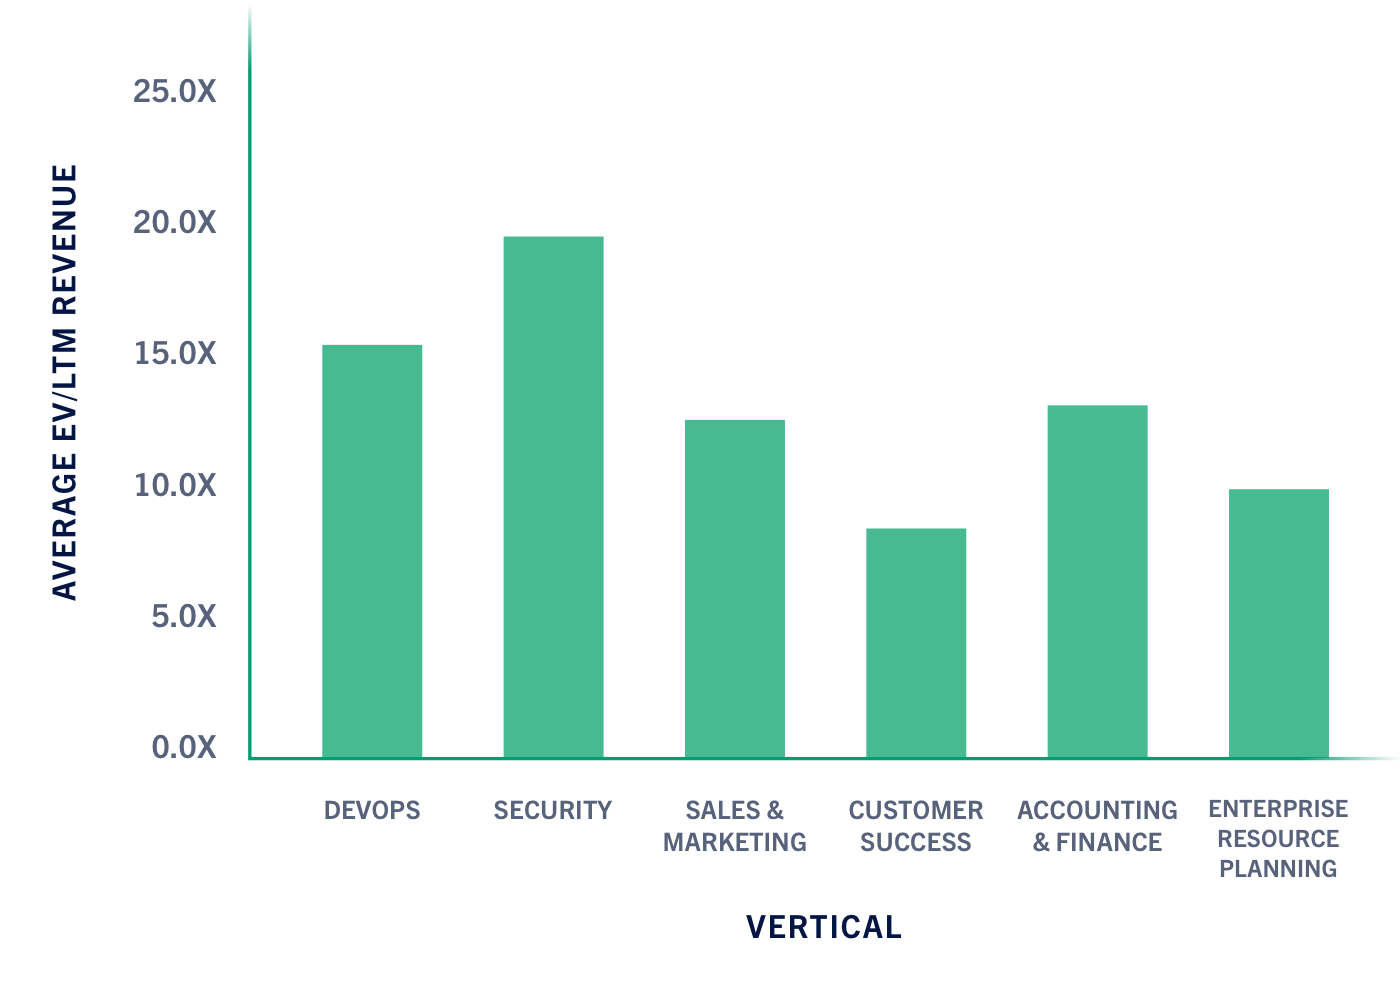
GC Public SaaS Tracker Average EV/LTM Revenue by Vertical1
GC Public SaaS Tracker Average EV/LTM Revenue by Vertical1
- Values reflect data from 3.31.2021–3.31.2022.
See the end of this report for the GC Public SaaS Tracker full company listing.
Source: CapIQ, Golub Capital
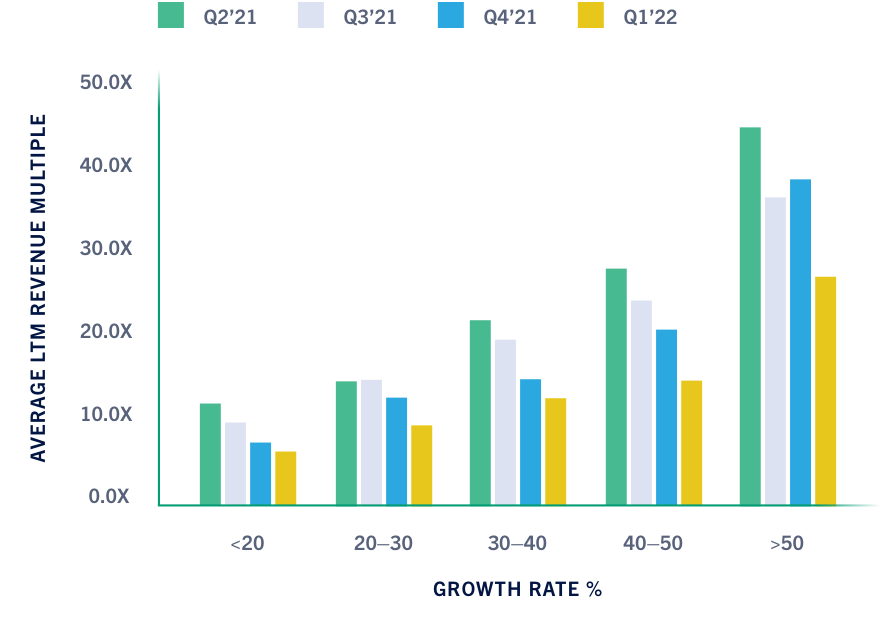
Average LTM Revenue Multiple of LTM Growth Rates (%)1,2
Average LTM Revenue Multiple of LTM Growth Rates (%)1,2
- Based on the companies within the GC Public SaaS Tracker.
- Values reflect data from the last day of the calendar quarter.
Source: CapIQ, Golub Capital
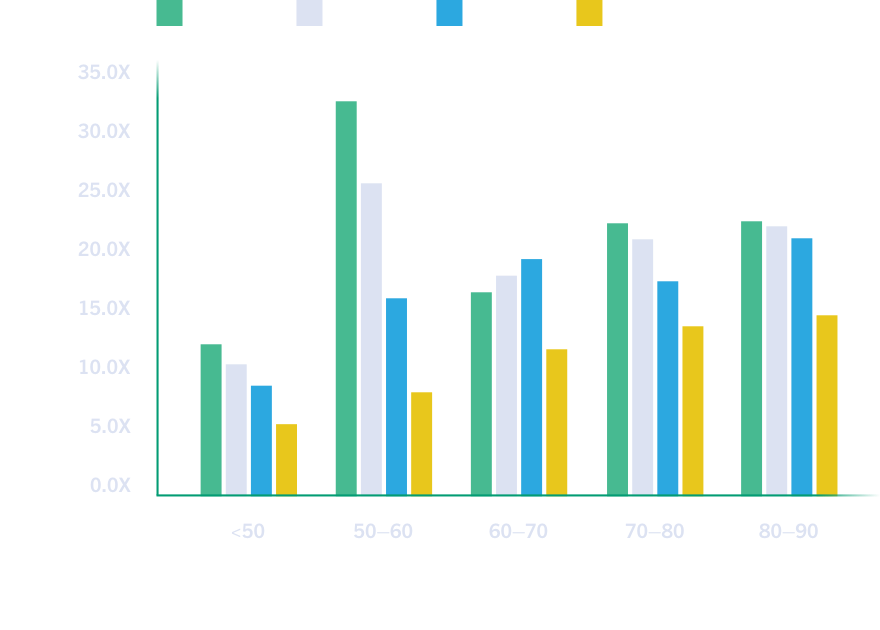
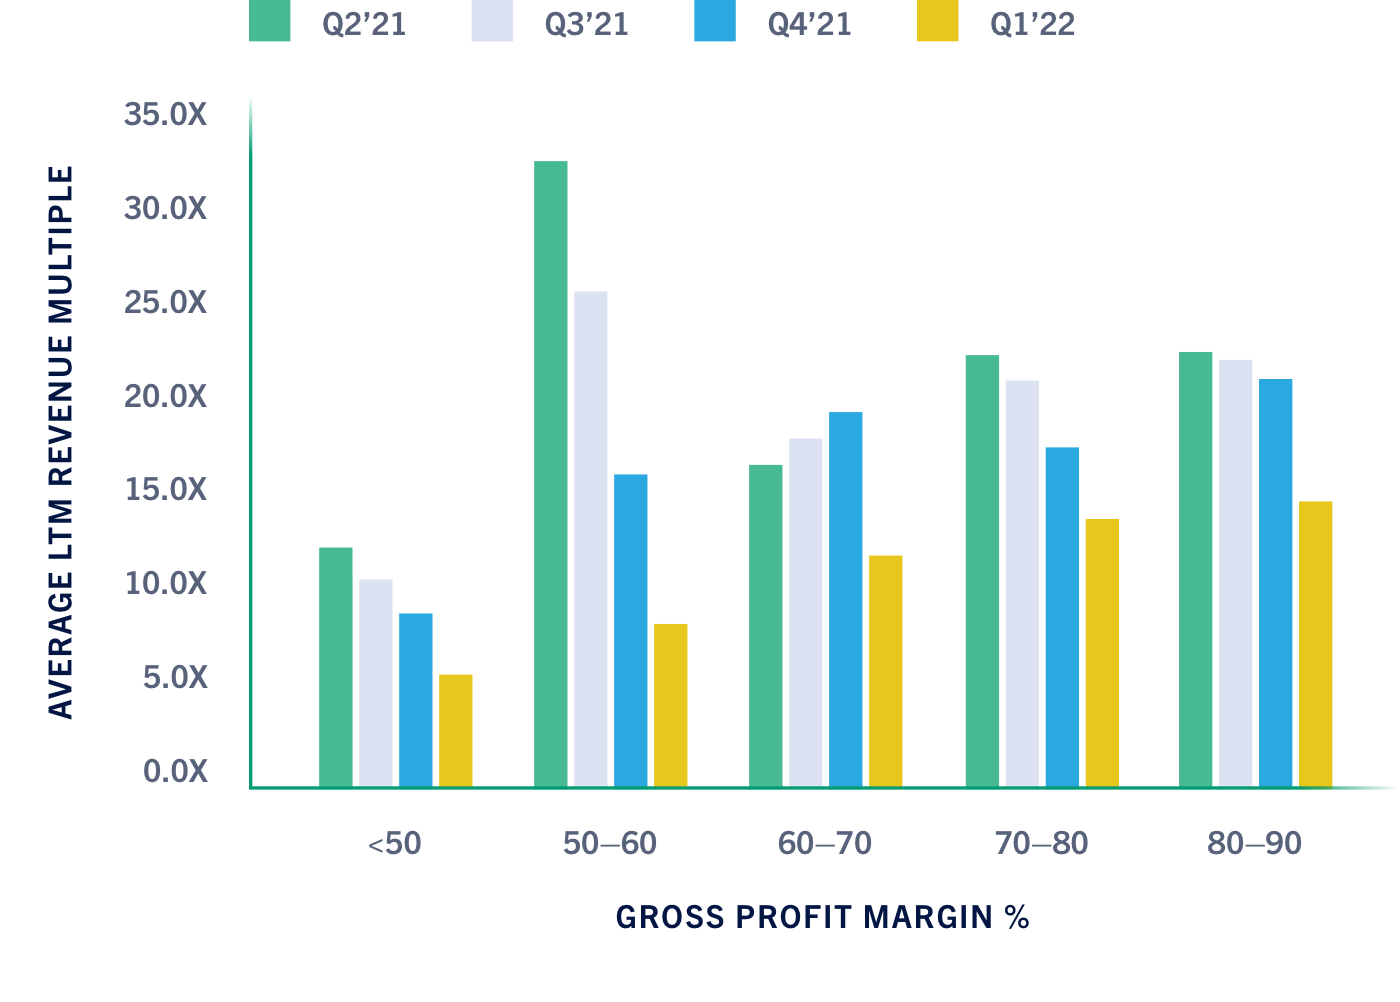
Average LTM Revenue Multiple of LTM Gross Profit Margins (%)1,2
Average LTM Revenue Multiple of LTM Gross Profit Margins (%)1,2
- Based on the companies within the GC Public SaaS Tracker.
- Values reflect data from the last day of the calendar quarter.
Source: CapIQ, Golub Capital
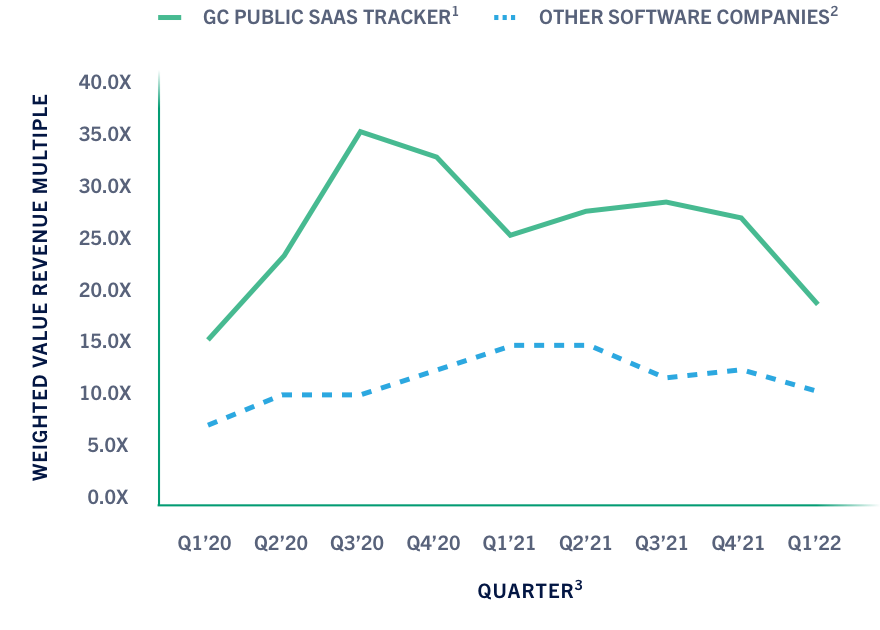
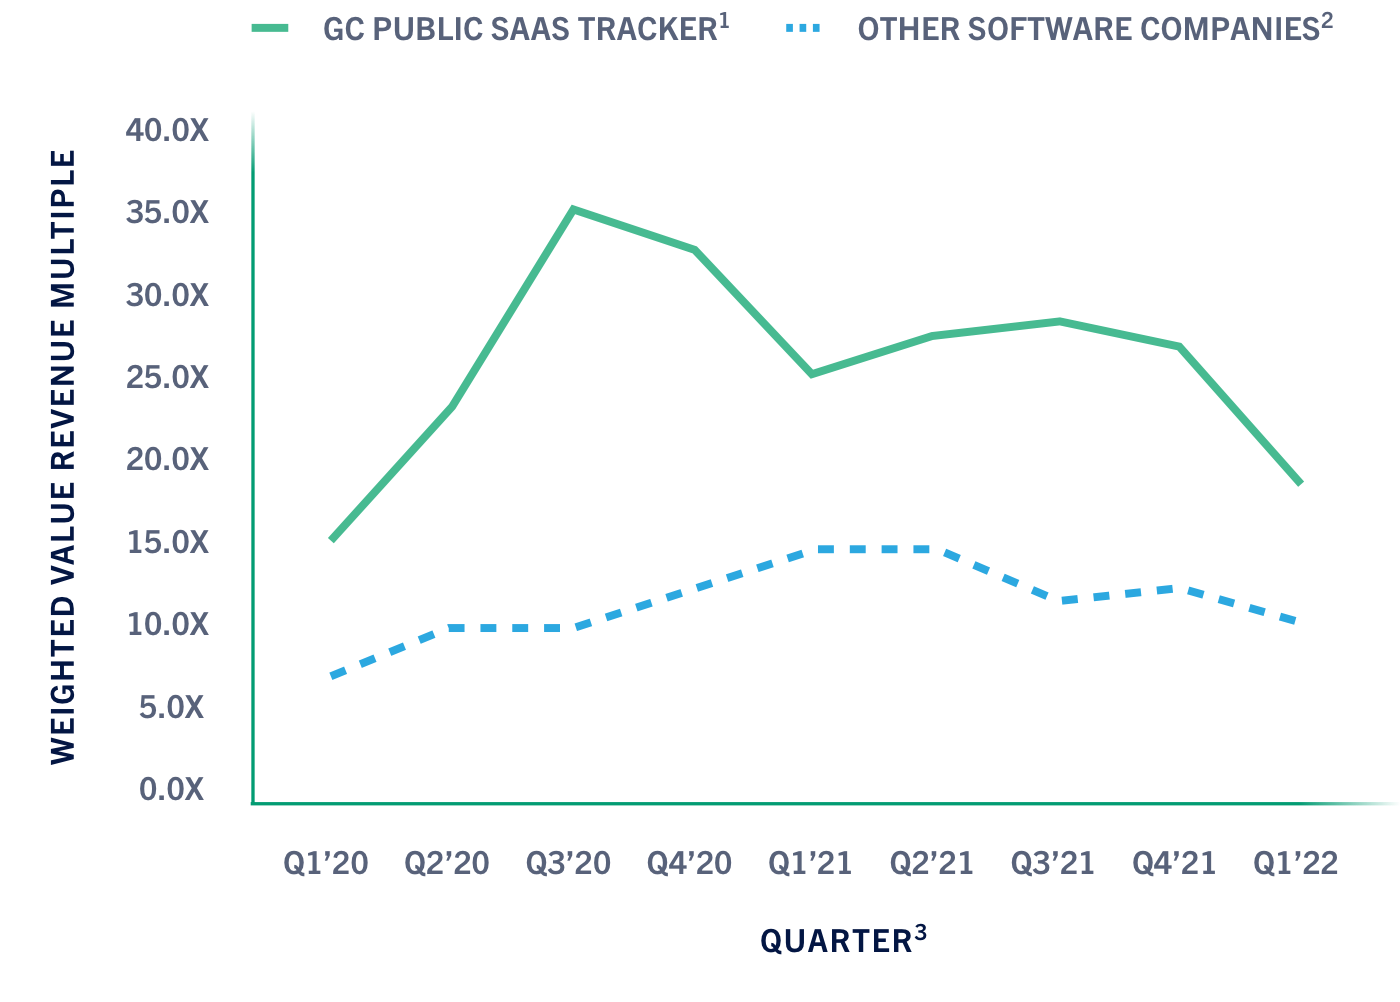
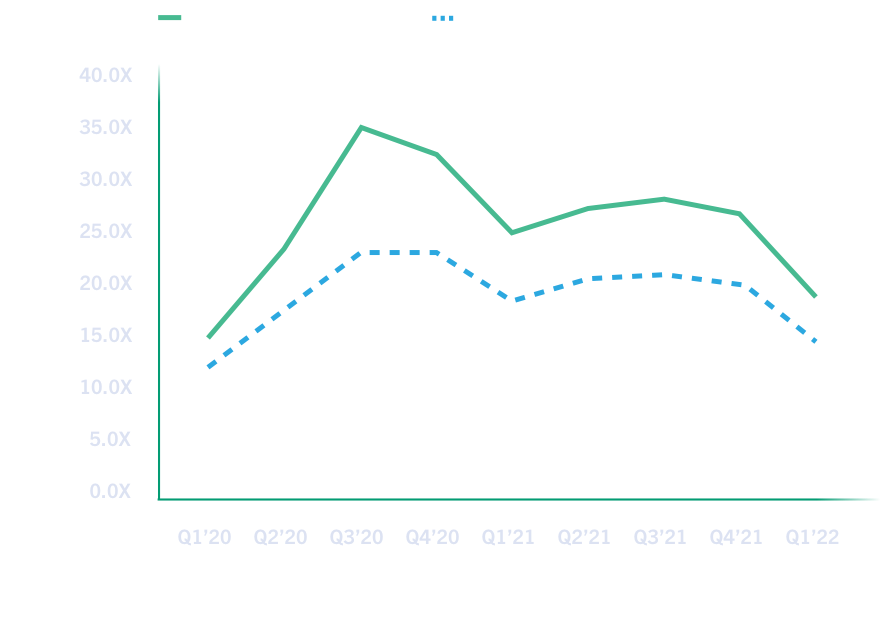
Weighted Average LTM Revenue Multiple
Weighted Average LTM Revenue Multiple
- Based on the companies within the GC Public SaaS Tracker.
- Other Software is typically defined as companies with perpetual license revenue models listed on Nasdaq and NYSE.
- Values reflect data from the last day of the calendar quarter.
Source: CapIQ, Golub Capital
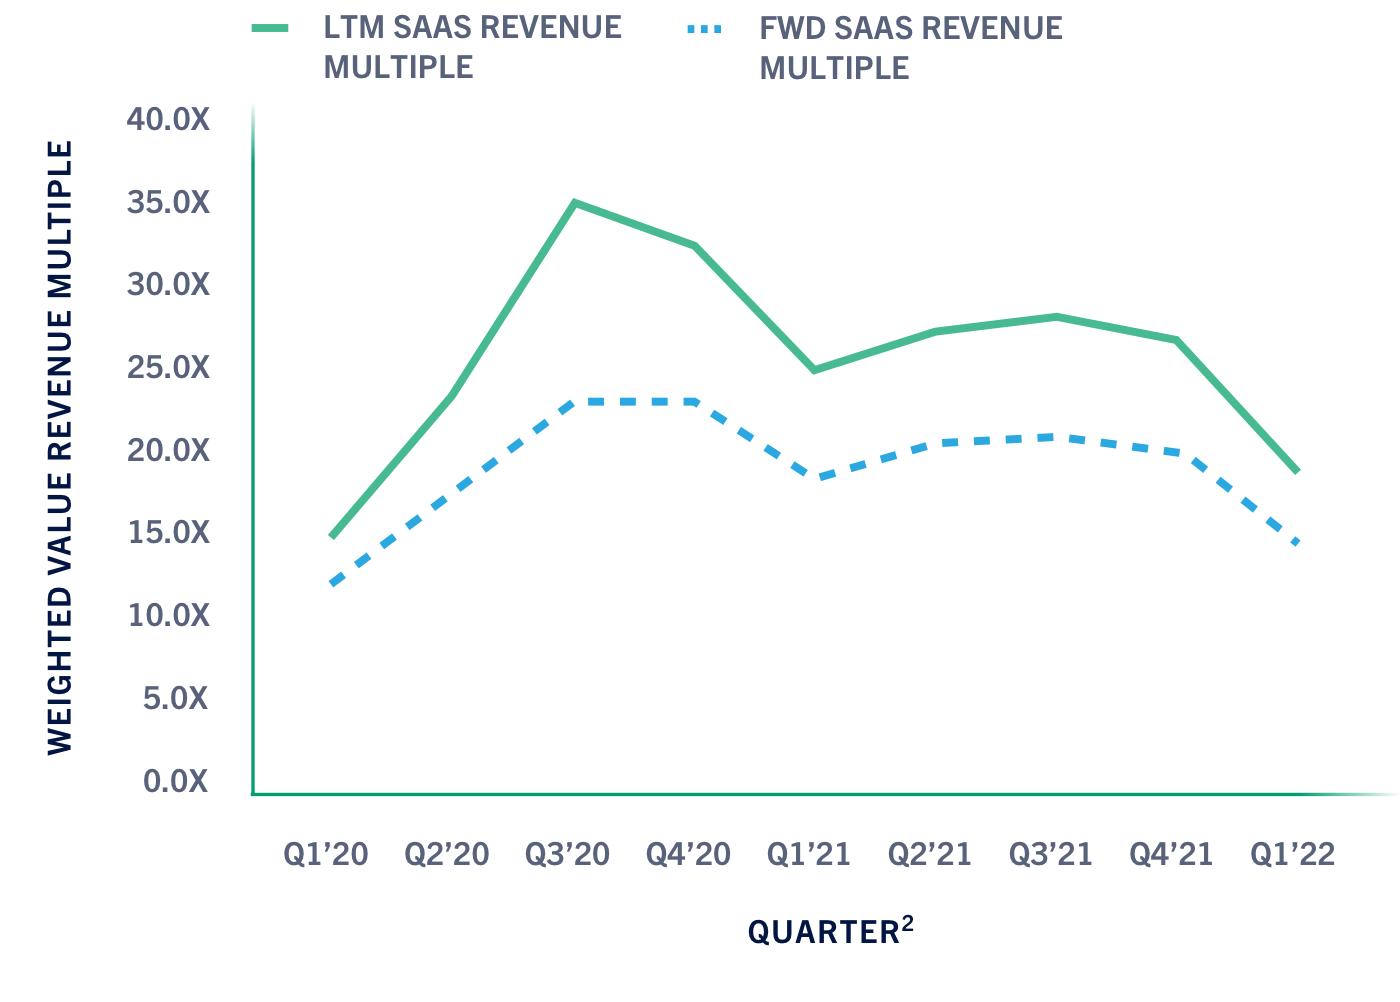
GC Public SaaS Tracker Weighted Average Revenue Multiple—LTM vs. FWD1
GC Public SaaS Tracker Weighted Average Revenue Multiple—LTM vs. FWD1
- Based on the companies within the GC Public SaaS Tracker.
- Values reflect data from the last day of the calendar quarter.
Source: CapIQ, Golub Capital
GC Public SaaS Tracker Average R&D Expenditure (%) vs. LTM Revenue Multiple1,2
GC Public SaaS Tracker Average R&D Expenditure (%) vs. LTM Revenue Multiple1,2
- Based on the companies within the GC Public SaaS Tracker.
- Values reflect data from the last day of the calendar quarter.
Source: CapIQ, Golub Capital
GC Public SaaS Tracker Average Sales and Marketing Expenditure (%) vs. LTM Revenue Multiple1,2
GC Public SaaS Tracker Average Sales and Marketing Expenditure (%) vs. LTM Revenue Multiple1,2
- Based on the companies within the GC Public SaaS Tracker.
- Values reflect data from the last day of calendar quarter.
Source: CapIQ, Golub Capital
Q1 2022 GC Public SaaS Tracker Companies1 Sorted by Market Cap
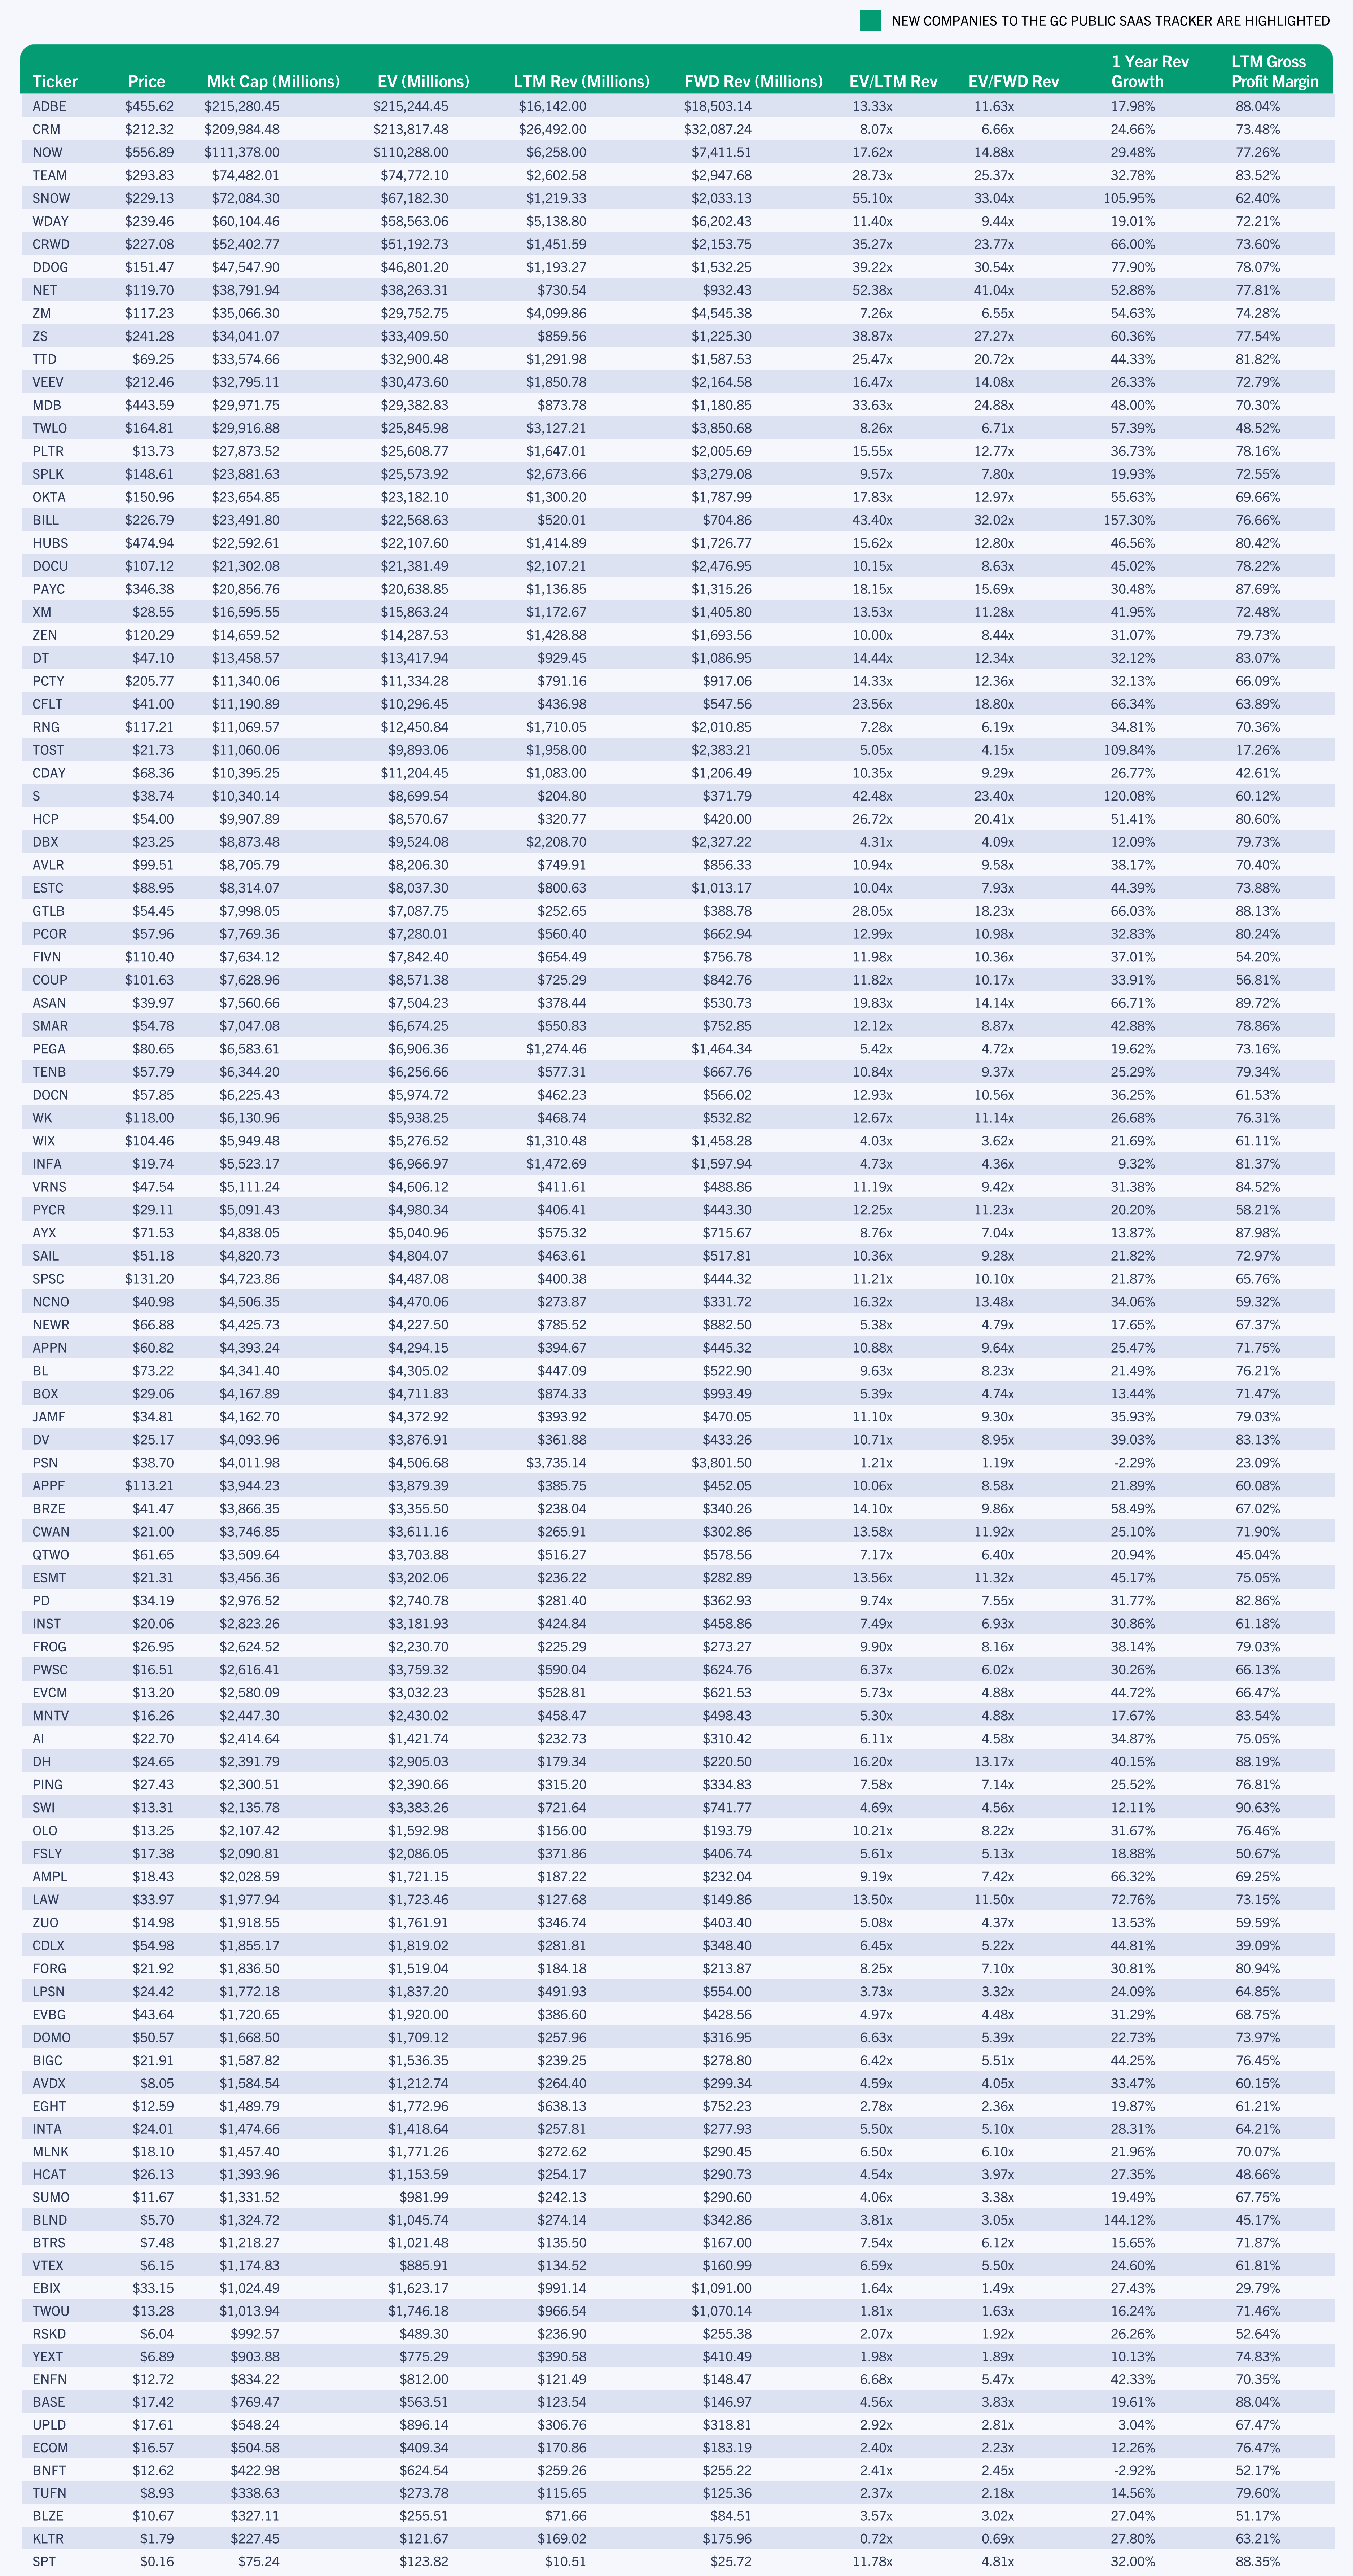
1. The SaaS Trackers described or illustrated herein are not actively managed or available for investment. The Public and Private SaaS Trackers are for illustrative and discussion purposes only, and any information pertaining to these trackers should not be construed as investment advice. Companies are added to the tracker in the quarter of their initial public offering and are removed when they are no longer publicly traded, when subscription-based software is no longer their primary product or primary source of YTD revenue, or when information on their revenue sourcing is not available or reliable due to extraneous circumstances (inability of company to file, etc.).
Please refer to Important Disclosures at the end of this report for more information on methodology.
All data as of 3.31.2022.
SaaS Meter Definitions
The Golub Capital Public SaaS Tracker
(“GC Public SaaS Tracker”)
Comprises publicly traded SaaS companies that are listed on the NYSE and Nasdaq. Golub Capital defines Software as a Service (SaaS) companies as software companies that show a year-to-date (YTD) share of revenue above 51% being sourced from subscriptions and subscription-related services. Such companies are added to the tracker in the quarter of their initial public offering and are removed when they are no longer publicly traded, when subscription-based software is no longer their primary product or primary source of YTD revenue or when information on their revenue sourcing is not available or reliable due to extraneous circumstances (inability of company to file, etc.). The GC Public SaaS Tracker is updated on a quarterly basis and is not actively managed or available for direct investment. The GC Public SaaS Tracker and companies therein are provided for informational purposes only and are not intended as investment advice or recommendations of any kind. The GC Public SaaS Tracker should not be relied upon in making any investment or business decisions. All data included is public information.
The Golub Capital Private SaaS Tracker
(“GC Private SaaS Tracker”)
Comprises private SaaS companies that are included in the “Golub Capital Altman Index.” Golub Capital defines Software as a Service (SaaS) companies based on their revenue model and product/service. These companies are typically subscription-based software companies, used by enterprises for functions such as analytics, workflow and data collection. The Golub Capital Altman Index measures the median revenue and earnings growth of approximately 120-150 privately owned companies in the Golub Capital loan portfolio for the first two months of each calendar quarter. The Golub Capital Altman Index is produced by Golub Capital in collaboration with credit expert Dr. Edward I. Altman.
PitchBook defines Software as a Service (SaaS)
As “Information technology companies which provide their software using client-server architectures that host the application in a centralized, off-site location.”
The GC SaaS Trackers
Described or illustrated herein are not actively managed or available for investment. The Public and Private SaaS Trackers are for illustrative and discussion purposes only, and therefore, any information pertaining to these trackers should not be misconstrued as investment advice. Trackers are shown for illustrative purposes only and are intended to provide general market data as a demonstration of current trends. Trackers should not be construed as investment advice and are not available for direct investment. No representation is made that any tracker is an appropriate measure for comparison or predictive of market trends. Golub Capital does not verify the accuracy or completeness of third-party data used in this report, and Golub Capital is not responsible or liable for any such content that may be inaccurate or incomplete. Third-party data is provided for informational purposes only.
Important Disclosures
Golub Capital (including its various affiliates) creates and manages multiple investment funds. GC Advisors LLC (“GC Advisors”) and GC OPAL Advisors (“GC OPAL Advisors,” and together with GC Advisors, the “Registered Advisers”) are investment advisers registered with the United States Securities and Exchange Commission (“SEC”) under the Investment Advisers Act of 1940. A number of other investment advisers, such as GC Investment Management LLC (“GC Investment Management”) and OPAL BSL LLC (Management Series) (collectively, the “Relying Advisers”) are registered in reliance upon GC OPAL Advisors’ registration. The Registered Advisers and the Relying Advisers (collectively, the “Advisers”) manage certain of Golub Capital’s affiliated funds and accounts. For a detailed description of the Advisers and each of their investment advisory fees, please see the Registered Advisers’ Form ADV Part 1 and 2A on file with the SEC.
No equity, debt or capital is being offered by means of these materials. These materials are for informational purposes only and are not an offer or solicitation to buy or sell any securities, make an investment, or participate in any loans. You should not rely on these materials in making any business decisions and these materials are not intended and should not be construed as investment advice. The information contained herein is preliminary and subject to change. While information herein has been obtained from sources believed to be reliable, no representation is made as to its completeness and accuracy.
Golub Capital investments are valued at each quarter-end at their fair value consistent with ASC Topic 820 and Golub Capital’s valuation policies and procedures. The current fair value of outstanding portfolio loans or other investments that are not actively traded is determined by the valuation policies and procedures by the Advisers, which are summarized in the Registered Advisers’ Form ADV Part 2A.
This material contains proprietary information, and the distribution of any of the contents herein to any other person without the prior written consent of Golub Capital is strictly prohibited.